
Dear Sir, Madam,
We are pleased to share details of our upcoming, training programs scheduled for November and December 2025.
- Monitoring, Evaluation, Accountability, and Learning (MEAL): Tools and Methodologies – modality (face-to-face)
- Data Speaks: Using R to Visualize Insights – modality (online)
We would also like to take this opportunity to share a concise summary of findings from our data projects and related research insights.
- Income Inequality and Economic Growth
- Community-based Monitoring System and Youth Employment and Entrepreneurship
- 2025 Floods in Pakistan and its Spread (Spatial Analysis)
1. Monitoring, Evaluation, Accountability, and Learning (MEAL): Tools and Methodologies – organized in Islamabad, Pakistan.
Training is scheduled for December 10-12, 2025
This is a three-day training workshop on Monitoring, Evaluation, Accountability, and Learning (MEAL): Tools and Methodologies. It is based on best global practices and focuses on sharing field-tested modules, skills, and innovations through experiential learning and interactive methodologies.
Who Should Attend?
The training is designed for a variety of professionals, including:
- Development and humanitarian professionals
- MEAL officers, program managers, and researchers
- Staff of NGOs, government agencies, and international organizations
- Students and early-career professionals aspiring to enter M&E fields
Participants will learn to:
- Explain the purpose, principles, and components of a MEAL system
- Design an M&E Framework, including indicators, data collection tools, and reporting mechanisms
- Apply practical tools for data collection, analysis, and visualization for program monitoring and evaluation
- Utilize participatory and results-based methods to enhance project performance and stakeholders engagement
- Understand approaches for integrating accountability and learning into organizational practices
To see the three-day training modules, download the training details from the link below.
Download the training details Register for the training
2. Data Speaks: Using R to Visualize Insights (online)
This workshop is a hands-on, online training designed for professionals and students who work with diverse data types (including official statistics, big data, and social media data) and aim to generate compelling insights.
- Dates: November 27-28, 2025 (runs from 07:00-10:00 UTC)
- Prerequisite: A separate 3-hour "Introduction to R" session is available on November 26, 2025, for those new to R.
The training is designed for a variety of professionals, including:
- Data Analysts and Statisticians who work in governments, national statistical offices, or research organizations
- Monitoring and Evaluation Officers, who wollect and analyze data but rely on Excel or manual charts
- Policy Analysts and Economists/Researchers and Economists
- Development Practitioners and Program Managers
- Students or early-career professionals in data science, economics, public health, or social sciences
- Communication staff who work on data storytelling or report preparations
- Consultants who prepare analytical reports for clients
Participants will learn to:
- Understand the role of data visualization in exploring, analyzing, and communicating insights effectively
- Use R and RStudio to import, prepare, and structure data for visualization
- Apply the ggplot2 package to create meaningful and publication-quality visualization
- Customize visual elements (themes, colors, labels, scales) to enhance clarity and storytelling
- Select appropriate chart types (bar, line, box, histogram, scatter, etc.) based on data and message
- Interpret visualization to drive and communicate key insights from data
- Create simple dashboards or multi-plot layouts for reports or presentations AND apply best practices in data visualization for transparency, accessibility, and impact
Download the training details Register for the training
Have a look at snapshots of previous trainings.
Statistical Summary and Insights Series
Income Inequality and Economic Growth
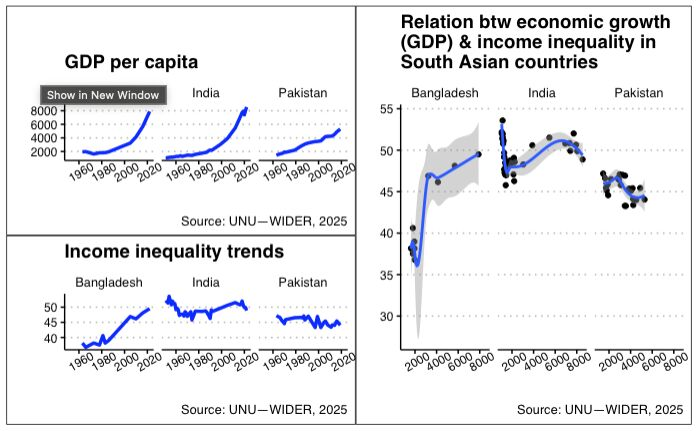
UNU-WIDER (2025) has recently released world inequality data. We quickly observed how inequality in three South Asian nations has changed over time and attempted to understand how the complex relationship between GDP and Gini behaves. One study by Centre for Economic Policy Research (CEPR), London, shows that when the Gini goes up, GDP goes down. It's complex to conclude, though, as another study by Kuznets determined that the Gini initially increases when the economy develops, and then it starts decreasing. Thus forming an inverted U-shaped relationship. In this case, Bangladesh needs to see what structural changes are slowing the decrease in inequality when income is growing, as amid economic growth, inequality is lingering a bit. India appears to be a special case, particularly at the start, however, it's taking shape. Pakistan's economy is the smallest among the three, and it has the lowest inequality. Its economy seems to be entering/has entered another phase where inequality is showing a slight upward trend. Hope it will not become a sinusoidal pattern.
-
Community-based Monitoring System (CBMS) and Youth Employment and Entrepreneurship
-
2025 Floods in Pakistan (Spatial Analysis
For more detailed analysis on CBMS and 2025 Floods in Pakistan, please visit our Insights Newsletter.
At RAI, we are passionate about turning data into meaningful action, enabling organizations to take informed policy decisions, establish monitoring & evaluation systems, measure impact, and be adaptive to changing needs. We have received an overwhelming response to reinitiating our training and capacity development program in Pakistan. These training programs are designed with the world's best practices in the field and reflect learning from multiple regional perspectives and capacity & capability challenges. There is no counter-argument to the fact that decisions informed by data, whether in the public or the private sector, can not go wrong, provided the right and quality data is used and the right analytic methods are applied. The best policy choices are always time-sensitive.
To know more about these and other topics, keep an eye on the upcoming news from us.
Have a look at our other services
...Keep yourself updated
Join us by subscribing to get the latest information about training and related announcements.
Subscribe NowThank you for being a part of our data-driven community. If you ever have questions or need tailored research or training, we are just a click away.
The RAI Team